Use locally on your workstation
Assuming you have already installed Node...
For information on using on a production host, see Remote Use.
Install
Install the full StrongLoop module that includes the client tools (Arc and slc) and StrongLoop Process Manager on your workstation for development and testing.
For more information, see Installing StrongLoop.
$ npm install -g strongloopStart application
Get an app if you don't have one handy.
$ git clone https://github.com/strongloop/express-example-app.git
After installing dependencies, start Process Manager locally and deploy the app to it.
Open http://localhost:3001 to see the app home page.
$ cd express-example-app
$ npm install
$ slc start
Process Manager is attempting to run app `.`.

  To confirm it is started: slc ctl status express-example-app
  To view the last logs: slc ctl log-dump express-example-app
  To see more options: slc ctl -h
  To see metrics, the profilers and other diagnostic features run: slc arc
Display app status
Get a quick status overview with all worker PIDs, cluster IDs, other key information.
$ slc ctl
Service ID: 1
Service Name: express-example-app
Environment variables:
  No environment variables defined
Instances:
    Version  Agent version  Cluster size
     4.1.0       1.5.1            4
Processes:
        ID      PID   WID  Listening Ports  Tracking objects?  CPU profiling?
    1.1.58223  58223   0
    1.1.58224  58224   1     0.0.0.0:3001
    1.1.58225  58225   2     0.0.0.0:3001
    1.1.58226  58226   3     0.0.0.0:3001
    1.1.58227  58227   4     0.0.0.0:3001
This tells you the app is running as a service called "express-example-app" with service ID 1.
By default, Process Manager uses a service name from the name property of the application's package.json. So, if you're not using express-example-app, then your service name will be different.
Change cluster size
By default the Process Manager runs one process per CPU. So, on a four-core system it will run the app in a four-process cluster.
You can easily change the cluster size. If you're not using express-example-app, be sure to substitute your service name in the command.
Now if you display status again, you'll see only two worker processes running:
$ slc ctl set-size express-example-app 2
$ slc ctl
...
Processes:
        ID      PID   WID  Listening Ports  Tracking objects?  CPU profiling?
    1.1.58223  58223   0
    1.1.58224  58224   1     0.0.0.0:3001
    1.1.58225  58225   2     0.0.0.0:3001
For more information see Clustering in the documentation.
View logs
$ slc ctl log-dump express-example-app --follow2015-03-25T04:21:08.447Z pid:70339 worker:0 INFO strong-agent using collector https://collector.strongloop.com:443
2015-03-25T04:21:08.447Z pid:70339 worker:0 INFO strong-agent v1.3.2 profiling app 'express-example-app' pid '70339'
2015-03-25T04:21:08.447Z pid:70339 worker:0 INFO strong-agent[70339] started profiling agent
2015-03-25T04:21:08.447Z pid:70339 worker:0 INFO supervisor starting (pid 70339)
2015-03-25T04:21:08.447Z pid:70339 worker:0 INFO strong-agent strong-agent using strong-cluster-control v2.0.0
2015-03-25T04:21:08.447Z pid:70339 worker:0 INFO supervisor reporting metrics to `internal:`
2015-03-25T04:21:08.451Z pid:70339 worker:0 INFO supervisor size set to 4
2015-03-25T04:21:08.455Z pid:70339 worker:0 INFO supervisor listening on 'runctl'
2015-03-25T04:21:08.521Z pid:70339 worker:0 INFO supervisor started worker 1 (pid 70340)
2015-03-25T04:21:08.656Z pid:70339 worker:0 INFO supervisor started worker 2 (pid 70341)
2015-03-25T04:21:08.775Z pid:70339 worker:0 INFO supervisor started worker 3 (pid 70342)
2015-03-25T04:21:08.948Z pid:70340 worker:1 INFO strong-agent[70340] started profiling agent
2015-03-25T04:21:08.949Z pid:70339 worker:0 INFO supervisor started worker 4 (pid 70343)
2015-03-25T04:21:08.950Z pid:70339 worker:0 INFO supervisor resized to 4
2015-03-25T04:21:08.970Z pid:70339 worker:0 INFO strong-agent[70339] connected to collector
2015-03-25T04:21:09.030Z pid:70341 worker:2 INFO strong-agent[70341] started profiling agent
2015-03-25T04:21:09.082Z pid:70340 worker:1 Listening on port: 3000
2015-03-25T04:21:09.159Z pid:70342 worker:3 INFO strong-agent[70342] started profiling agent
2015-03-25T04:21:09.229Z pid:70343 worker:4 INFO strong-agent[70343] started profiling agent
2015-03-25T04:21:09.231Z pid:70341 worker:2 Listening on port: 3000
2015-03-25T04:21:09.758Z pid:70342 worker:3 Listening on port: 3000
2015-03-25T04:21:09.759Z pid:70343 worker:4 Listening on port: 3000
2015-03-25T04:21:09.760Z pid:70340 worker:1 INFO strong-agent[70340] connected to collector
2015-03-25T04:21:09.840Z pid:70341 worker:2 INFO strong-agent[70341] connected to collector
2015-03-25T04:21:09.873Z pid:70342 worker:3 INFO strong-agent[70342] connected to collector
2015-03-25T04:21:09.955Z pid:70343 worker:4 INFO strong-agent[70343] connected to collector
Update your environment with no downtime
Use the ctl env-set command to change environment variables on the fly.
$ slc ctl env-set express-example-app NODE_ENV=production
Environment updated: Updated environment, restarting app
View CPU and memory profiles
To get meaningful data, run the profiler while your application is under typical or high load.
- Determine the process ID of one of the worker processes with slc ctl, as you did above.
- Start the CPU profiler for the process, as shown in the example at right.
- Let the profiler run for five to ten seconds.
- Stop the CPU profiler, as shown in the example at right.
$ slc ctl cpu-start 1.1.58224
Profiler started, use cpu-stop to get profile
$ slc ctl cpu-stop 1.1.58224
CPU profile written to `node.1.1.58224.cpuprofile`,
load into Chrome Dev Tools
Start StrongLoop Arc and log in to view the profile data.
$ slc arc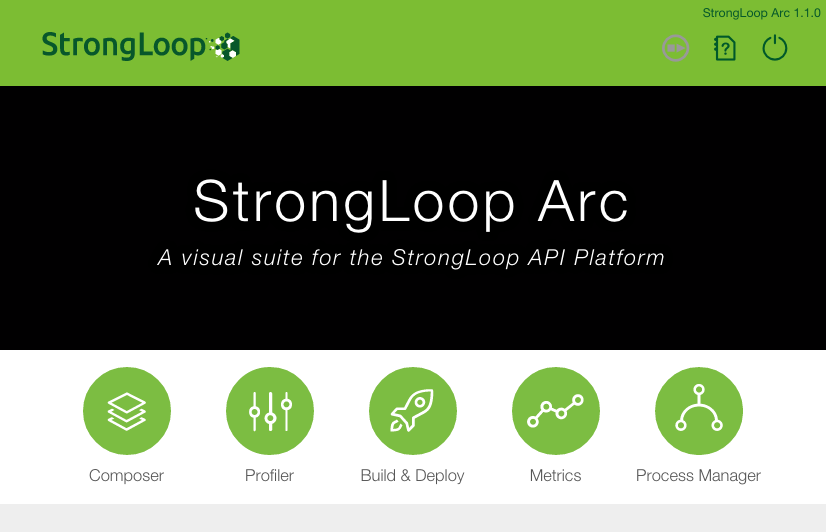
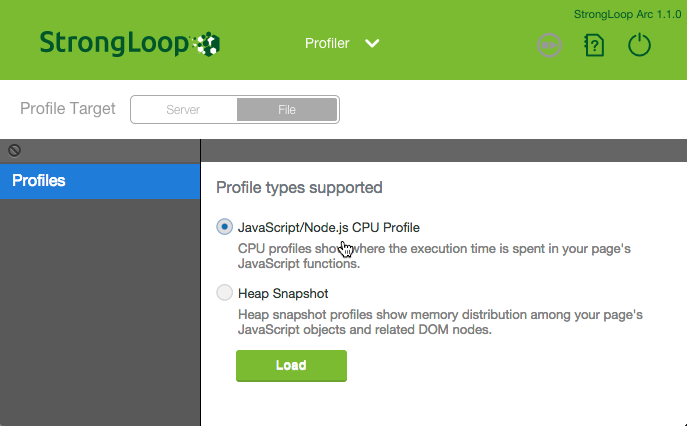
In Arc, click Profiler.
In Arc Profiler:
- Click File to load the profile you just generated.
- Make sure "JavScript/Node.js CPU Profile" is selected.
- Click Load.
- Choose the .cpuprofile file you generated. The file will then be listed in in the Profiles list.
- Click on the file name in the Profiles list. You'll see the CPU profile data, as illustrated below.

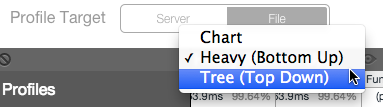
Click the inverted triangle to display the data in different ways.
You can generate heap snapshots following the same process. Just use this command instead (for example for pid 22670):
$ slc ctl heap-snapshot 1.1.22670For more information, see Profiling in the documentation.
Monitor performance metrics
Monitoring performance metrics requires a StrongLoop product license key. You automatically get a free trial license key valid for 30 days from the first time you run Arc. For more information, see Managing your licenses.
- Start Arc and log in.
- Click Metrics.
Arc will show the process IDs (PIDs) for the local app - Click Load.
Wait a minute or two and you will see peformance metrics, including statistics on CPU use, event loop execution, and heap memory consumption for the selected process, for example, as shown below.
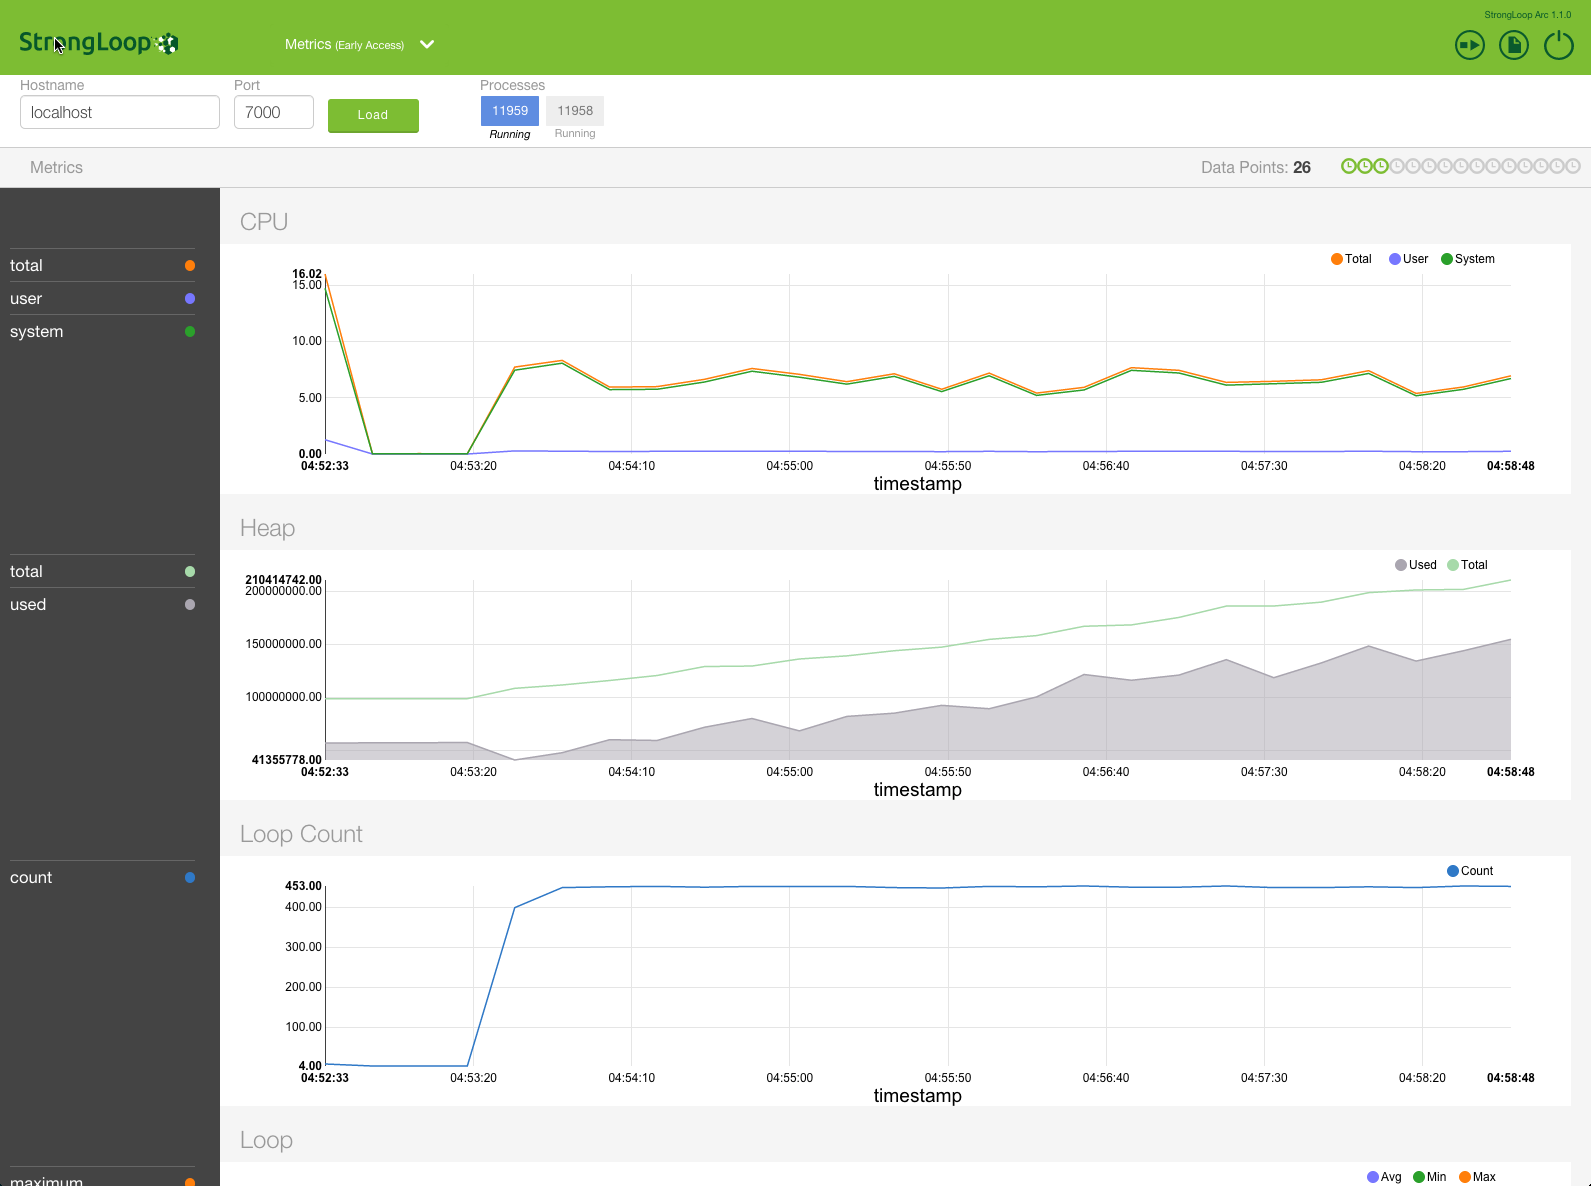
NOTE: Depending on the application your're using, your metrics graphs might not be as interesting as those shown here.
For details on the available metrics, see Available metrics.